Sparklines in MS Excel: What They Are & How to Create Them

One underused, very neglected feature in Excel is sparklines.  When you want to portray a trend in the numbers in your spreadsheet, the best option is to give it a visual dimension, so that it has a much greater impact on the viewer than just showing numbers on a screen (or page).  The obvious avenue to pursue might be to create a chart, and certainly Excel contains a very powerful and elaborate charting facility, that you could employ to serve this need to great effect. However, you may want a simple pictorial representation of the trend that your numbers convey without wanting to invest the time and effort that a full-scale chart might require.

In this case, a sparkline might do just the job that you seek.  The best way to envisage a sparkline is as a miniature chart that occupies no more than a single cell adjacent to the numbers.   The sparklines feature resides on the Insert tab in Excel, just over the halfway point, not far from the charting options.  Perhaps this location, so close to the more commonly used charting creation commands, helps to explain why sparklines tend to be neglected and somewhat underutilised by many Excel users.  (Two of the sparkline options are labelled as ‘line’ and ‘column’ and so, inevitably, they are confused with the charting features that carry the same name and are very nearby on the same ribbon.)

Sparklines are very simple to create. You need only select the first individual cell in the destination range that you intend to populate with sparklines.  Then, go to the Insert tab and locate the Sparklines group, slightly further than halfway along the ribbon.  You have an initial choice of three types of sparkline: line, column or win/loss. (If you are unsure of which type of sparkline will work best, you need not be concerned; you are not “locked in” to your first choice.  You can always revisit your choice at any time, and if need be, change your existing sparkline to any of the other options.)

When you select one of the three sparkline options, Excel will ask you for the spreadsheet range that you will base your first sparkline on, and the cell or range you intend to place your sparkline in:
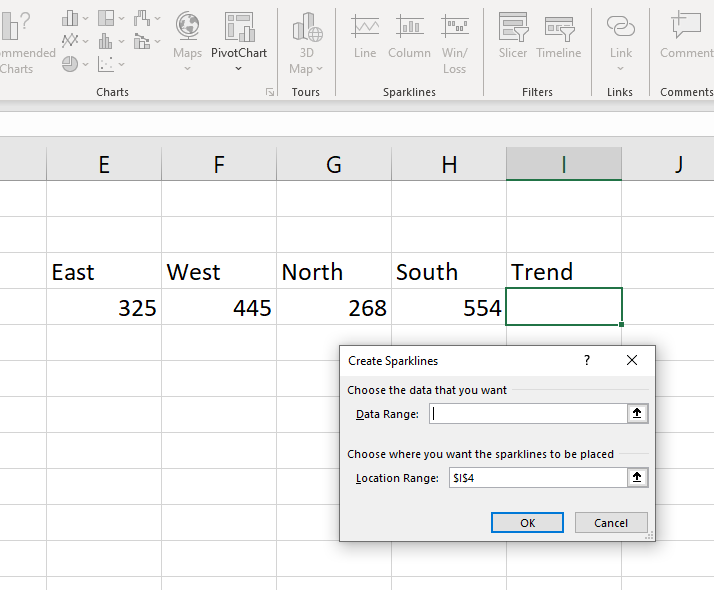
As you can see, the contents of the Location Range box will be the cell you have already chosen.  You just need to place your cursor in the Data Range box, and then select the range that contains the numbers that you wish to use for your sparklines.  In the example above, the Data Range is E4:H4.) Then, select OK and the Location Range cell will display your sparkline result. If you wish to copy the sparkline into an adjacent range of cells, you can use the small green “fill handle” in the lower right corner to easily accomplish this.

To modify your sparkline, you can simply select the cell (or cells) that contain the sparklines, and you will find a Sparklines tab suddenly becomes available at the top of your screen.  The Sparklines tab is a ‘contextual’ tab that only appears when the user selects cells that already contain sparklines.  The attached ribbon presents a range of options that allow you to modify your sparklines, including another chance to choose from the original three sparkline varieties, a style gallery, and the capacity to attach and colour-code markers on various data points on your sparkline.  The options available to you on the sparklines ribbon can be seen on the example below:

Sparklines provide you with a fast and flexible way to add an extra visual dimension to your spreadsheet presentation.

Flash Fill: Data Extraction in MS Excel

In its most recent iterations, Microsoft Excel has changed only minimally, at least as far as the average user is concerned.  Microsoft have only added a few ‘bells and whistles’ to the familiar interface, which have not changed the user’s experience in any fundamental way.  However, one particularly useful enhancement was added to the 2013 version to make the challenge of data extraction both simpler and more intuitive.

Imagine that you are called upon to work with and manage a dataset in an Excel spreadsheet that contains a series of individual names, be they employees, clients, stakeholders or what have you.  The names are contained within a single column, with each consecutive cell containing both the first and last name of the individual concerned, as in the example below:

The problem here lies in the difficulty involved in trying to manage and analyse data in this configuration.  For example, if you want to sort these records in order of the last name, there is no simple way to accomplish this.  With the first and last names combined in the same column in this way, life is much more difficult when it comes to the manipulation and meaningful interpretation of these records.  You really need to separate the first and last names into separate distinct columns to provide you with the flexibility needed in order to facilitate the greater manipulation you desire.

There exist two obvious ways to achieve this.

  • There has long been a feature in Excel called Text to Columns, found a little more than ½ way along the Data ribbon, which exists for the sole purpose of dividing single columns of text into multiple columns of text. This can do the job well, but it requires the user to navigate their way through a series of screens in a wizard to achieve the desired outcome.
  • You can undertake an exhaustive (and quite possibly exhausting) cut and paste operation to create the separate columns as required.  The obvious problem with this is that you may have a significant list of, for example, 100 (or more) names; going the cut-and-paste route could be tedious and long-winded in the extreme.

There must be a better way to achieve this kind of data extraction in a simpler and more intuitive way. Happily, from the 2013 version onwards, there is.

If you go to a blank column adjacent to the list of names and enter a copy of the first name (insert a new blank column if necessary), you can then use the Fill Handle i.e. the little green square in the lower right corner of the cell to copy this name down to the rest of the cells in the column below.  The use of the fill handle in this way will simply copy the contents of the original cell, which is obviously not what you want.

However, if you immediately activate the Autofill Options menu that will appear in the lower right corner of your destination range, you will see that the last choice at the foot of this menu is called Flash Fill.  If you choose this command, Excel will then produce a list of names from the same relative location in the source column, as in the example below:

Flash Fill can also be found in an alternative location on the immediate right of Text to Columns, in the Data Tools group on the Data tab.  The only possible complication with this method of data extraction is the circumstance that the data in the source column does not all conform to the exact same pattern.  The example that I’ve used so far assumes that each cell in the source contains the first name at the start followed by the last name with a space separating the names.  If one or more of the names doesn’t follow the same pattern, Flash Fill is not clever enough to cope with that situation and will not produce a result for these names as intended; you may find that you will be left with a blank row in this location.

However, by and large Flash Fill is a useful addition to the Excel repertoire, and can provide a much simpler and more efficient means of extracting data across a range of different scenarios.  For example, it is often used to extract the individual elements from an address field and hence create separate columns for street, suburb, state, postcode et al.  This example described here merely skims the surface of the applications of Flash Fill in Excel: it can be a most versatile and flexible element in your spreadsheet toolkit.

Excelling at Excel

Excel is Microsoft’s “killer app”, an indispensable tool for spreadsheet users from all walks of life. Explore the posts below, my human friends, if you seek to unlock the true potential of Excel:

Create a growth series of values in Excel

Create your own personal Autofill series in Excel to save yourself time and effort in repetitive typing

Add some pizzazz to your spreadsheets with some conditional formatting

Take your conditional formatting a step further

Perform some clever date arithmetic in Excel

Make an Excel page “very” hidden

A “warp speed” shortcut to create simple charts in Excel

Extract data for easier manipulation with Flash Fill

Create and modify sparklines to add some additional visual impact to your spreadsheet presentation

Safeguard and protect your valuable spreadsheet content from sabotage, inadvertent or otherwise, by protecting your spreadsheet in Excel

Add some Validation rules to your spreadsheet to ensure that your fellow users only input valid, correct data in the appropriate location

Conditional Formatting in MS Excel 2: Highlighting Trends

Conditional Formatting in Excel can be used in a variety of ways that can go far beyond simply adding an extra visual emphasis to your important values.  For example, you can use it to give pictorial expression to the trend created by a data series in a spreadsheet. This option can be found further down the main conditional formatting menu, and you can apply it in one of three ways:

  • Coloured Data Bars
  • Colour Scales
  • Icon Sets (symbols)

If, for example, you wanted a visual representation of the differential created by the trend in a series of monthly results;  you can do this by applying your choice of Data Bars to the range in question.

The extent and degree of shading in each cell is determined by the value it contains, compared to the other numbers in the same range.   The higher numbers in the trend exhibit a much higher degree of shading than do the lower ones.  This gives you a method of visually portraying the trend in these numbers, giving your spreadsheet much greater impact than just displaying the bare numbers alone on the screen or page.

If you find that the coloured data bars don’t quite do it for you, there are two other alternatives available on the same menu:

You could go with colour scales, whereby you can represent the same trend with entirely different colours for the higher, lower and in-between numbers. Or you could instead go with Icon Sets and display different symbols such as flags or arrows alongside numbers at different points in the trend.  With any of these choices, you can add a crucial extra visual dimension to your spreadsheet’s presentation.  Which can be particularly useful if you find yourself reporting to a person who sees many spreadsheets in the average day, so much so that they blend together in one homogeneous Excel-y mass.  Conditional formatting is a surefire way of making your spreadsheets stand apart from the crowd!

This assumes ,of course, that you want your spreadsheets to command this sort of attention. And one assumes that you do, at least occasionally, otherwise why would you be reading this post?

Should you wish at a later stage, to edit or modify these conditional formatting rules, you can do so as with any rule – via the Manage Rules option on the Conditional Formatting menu. This dialog box contains both Edit and Delete buttons.

(Bear in mind that you cannot delete conditional formatting via the usual Delete key on your keyboard; this will clear the contents of cells, not the formatting.)

Creating a Growth Series in MS Excel

The little, green ‘Fill Handle’ in the lower right hand corner of a selected cell in an Excel spreadsheet is a very versatile asset. It provides an easy way of copying the contents of cells, especially formulas, into adjacent cells. It can also automate the creation of common labels such as the names of months and weekdays.  One need only enter the initial label (e.g January, Monday), position the mouse over the fill handle in the lower right, and then drag over the required range in the adjacent row or column, and…Voila!

With a simple but clever variation on this technique, you can also easily produce a ‘growth’ series,  Just enter the first two values of your intended series, in order to define the increment that you want between the values:

i.e. 20,24…28,32,36,40

Then select both the first two cells, and use the fill handle to create your series with the required growth factor between the successive values.

This method is also ideal for a series of dates. Again, simply enter the first two dates in your intended series, to define the pattern you seek:

i.e. 16/11/18, 23/11/18…30/11/18,7/12/18, 14/12/18

This can be  a great way to eliminate much of the tedium of creating rosters, time sheets and the like in your Excel spreadsheets.

Creating a Personal AutoFill Series in MS Excel

Most relatively experienced Excel users are familiar with the use of the Fill Handle, the little green square in the lower right corner of the selected cell, to automate and streamline many routine spreadsheet functions.  For example, it provides the user with a simple way to copy formulas into adjacent cells.  It is also a great way to “Autofill” a common series of labels, such as weekdays or months.  You can just enter the initial label in the first cell (e.g. January, Monday…) position the mouse over the Fill Handle and then drag to the right or down to complete the series as required.

The good news here is that you can “tame” the AutoFill feature to create your own personalised series, and automate its creation in any spreadsheet in the future. Simply create a version of your intended series in consecutive cells in any spreadsheet,and then select (highlight) this range.  Go to the File tab and select Options, the last choice on the lower left hand side. Then select the “Advanced” category on the left, and scroll down the right hand screen until you encounter a button bearing the label: “Edit Custom Lists…”

This is the ‘brains’ of the ‘Autofill’ feature.  In this dialogue box, you will see your selected range already visible in the “Import list from cells” box on the lower right. If you simply click on the Import button, your list will join the master “list of lists” in the window on the left.  You can then create this list via the same AutoFill handle maneuver, and thus significantly accelerate your routine typing process, and earn the undying respect and awe of your workmates and colleagues.

Making an Excel Page “Really” Hidden

A common gripe from many Excel users is the harm, inadvertent or otherwise, caused by workplace colleagues with whom they share their carefully constructed and designed spreadsheets.

In particular, you might well go to great lengths to set up the (confidential?) source data used by the functions and formulas in one spreadsheet. and to keep it secure, store them separately in another sheet in the same workbook. You can, of course, simply hide this sheet via a simple right-click on the sheet tab and choosing the “Hide” command.  This can be an effective strategy with many users who don’t know Excel to any great degree of sophistication, and are hence unlikely to invest much time looking for sheets that they can’t see anyway and of whose very existence they are unaware.

Problem is, any mildly curious or relatively “savvy” colleague can easily “unhide” the sheet via the same simple pathway used to hide it i.e right-mouse click. Thus, this is not by any means a secure means of hiding a sheet and hence might mayhem, and in extreme cases, fisticuffs ensue.

However, despair ye not, Excel brethren.  For the truly savvy, there exists a more impregnable way to make a sheet “really” hidden; a method far less likely to be rumbled by inquisitive workmates.  It involves going “backstage” In Excel and visiting the Code window, again by right-clicking the intended sheet tab and selecting the “View Code” command.  You might imagine that this environment might necessitate a knowledge of the arcane world of VisualBasic programming, but happily, no such knowledge is required.  The Code window should display two window panes on its right-hand side – the Project Explorer and the Properties pane. (If it does not,these panes are easily available via the View menu.)

In the Properties pane, you will find a comprehensive, alphabetic list of the current sheet’s properties, the last of which is  “Visible”. The menu on its immediate right contains three choices, the last of which rejoices in the name “VeryHidden”,  (By the way, the second option”Hidden” is equivalent to the “Hide” command on the right-click menu.)  If you choose “VeryHidden” in this menu, the sheet tab will disappear from normal view, and the “Unhide” command on the usual right-click menu will also be greyed out and hence unavailable.  Therefore, this particular stratagem is far more secure than the aforementioned default “Hide”command.

Of course, the obvious loophole is that another suitably savvy Excel user could also reverse-engineer this method. But you might consider that while another user could randomly discover the default “Unhide” command, the average user is far less likely to know about the Code window and the “VeryHidden” property.  By this means might you better safeguard your crucial spreadsheets from your colleagues’ sabotage, be it inadvertent or deliberate.